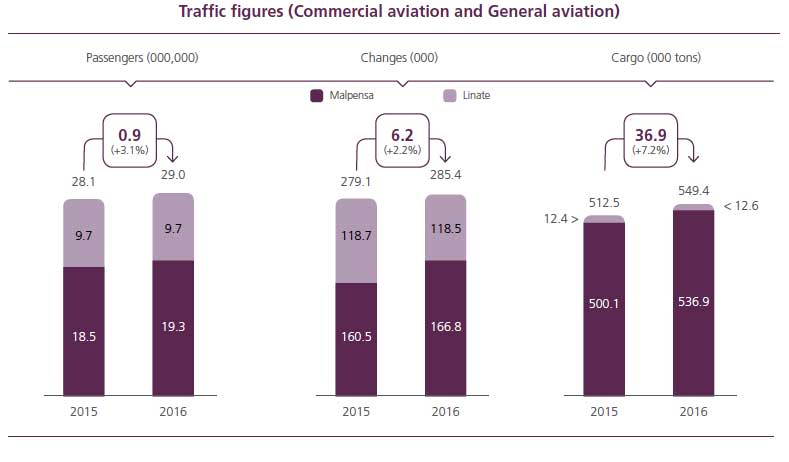
The condensed consolidated figures taken from the financial statements are illustrated below.
Profit and Loss Figures
| (in thousands of Euro) | 2016 | 2015 | Delta |
|---|---|---|---|
| Revenue | 700,134 | 694,792 | 5,342 |
| EBITDA (1) | 234,403 | 223,076 | 11,327 |
| EBIT | 149,999 | 146,065 | 3,934 |
| Pre-tax profit | 141,037 | 134,718 | 6,319 |
| Disconitnued Operations profit/(loss) (2) | (130) | 3,238 | (3,368) |
| Group Net Profit | 93,619 | 83,850 | 9,769 |
(1) EBITDA is calculated as the difference between total revenues and total costs, excluding provisions and write-downs. EBITDA in the comparative period, which also included provisions and write-downs with the exception of the restoration and replacement provision was therefore restated according to the new approach in order to ensure data comparability as shown in the Explanatory Notes paragraph 2.1 “Basis of preparation”.
(2) The profit/loss of the company SEA Handling SpA in liquidation is reported in the "Discontinued operations profit/(loss)" line as required by IFRS 5.
Financial Figures
| (in thousands of Euro) | At December 31. 2016 | At December 31. 2015 | Delta |
|---|---|---|---|
| Fixed Assets (A) | 1,317,157 | 1,306,932 | 10,225 |
| Working capital (B) | (188,683) | (197,299) | 8,616 |
| Provision for risks and charges ( C) | (174,061) | (177,902) | 3,841 |
| Employee benefit provisions (D) | (49,220) | (48,239) | (981) |
| Net capital employed (A+B+C+D) | 905,193 | 883,492 | 21,701 |
| Group Shareholders' equity | 375,264 | 344,668 | 30,596 |
| Minority interests | 566 | 541 | 25 |
| Net Debt | 529,363 | 538,283 | (8,920) |
| Total sources of financings | 905,193 | 883,492 | 21,701 |
(A) Fixed assets, including those falling within IFRIC 12 scope, are shown net of fixed assets financed by State and European Community grants. At December 31, 2016 the latter amounted to Euro 503,601 thousand and Euro 5,517 thousand respectively and at December 31, 2015 they amounted to Euro 498,553 thousand and Euro 5,517 thousand respectively.
| (in thousands of Euro) | At December 31, 2016 | At December 31, 2015 | Delta |
|---|---|---|---|
| Investments in tangible and intangible assets | 69,487 | 86,780 | (17,293) |
Other indicators
| At December 31, 2016 | At December 31, 2015 | |
|---|---|---|
| NPF/EBITDA | 2.26 | 2.41 |
| Employees HDC | 2,866 | 2,905 |

